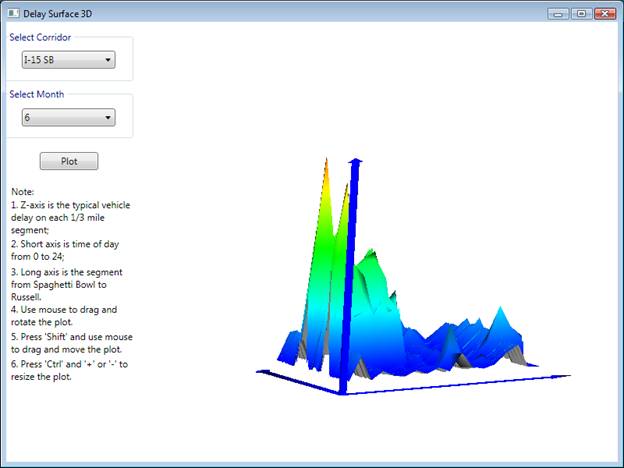
Freeway – Vehicle Delay Surface Plot
This interactive Vehicle Delay Surface 3D Plot is used to investigate typical vehicle delay on each 1/3 mile segment of a corridor from 0 to 24. By comparing the delay surface of different month, the freeway performance improvement can be easily observed. For example, I-15 Express Lanes were opened on 6/25/2010. By comparing the I-15 SB Delay Surface Plots of June and July, you may observe that more than 50% delay is mitigated since express lanes opened, and I-15 SB Sahara bottleneck is eliminated.
How to use:
1. Select corridor and month;
2. Click “Plot” to draw the vehicle delay surface 3d plot;
3. Use mouse to drag and rotate the plot;
4. Press “Shift” and use mouse to drag and move the plot;
5. Press “Ctrl” and “+” or “-” to resize the plot.
Note:
· The Z-axis is the typical vehicle delay on each 1/3 mile segment;
· Short axis is the time of day from 0 to 24;
· Long axis is the segment. For I-15 SB, it is from US-95 (Spaghetti Bowl) to Russell Rd; For I-15 NB, it is from Russell Rd to US-95;
· In this version, only I-15 NB and SB are available, more corridor will be available in the next version; The selected months are from June 2010 to Oct 2010, more months will be added and updated;
· The axis label and grid will be added in the next version.