Freeway – Historical Traffic Map
In Historical Traffic Map Page, you can play the historical traffic animation to review and evaluate the freeway performance of the past, as well as see the crash/incident impact on traffic.
How to use:
1. Click on the “User Defined” tab on the home page map section, it will open the Historical Traffic Map Page;
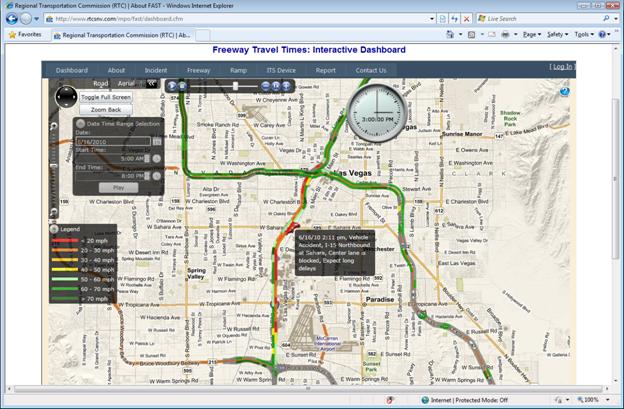
2. The Historical Traffic Map Page will automatically load and play the traffic animation of day 3 months ago;
3. You can select the date and time range from the “Date Time Range Selection” panel to view any date of the past two years historical traffic. If the data are not available, it will show “Load Data Error” message;
4. Traffic incident will fly-into its location one hour before its occurrence; Flash during its happening; Fade-out after its clearance to show its residual impact. You can click on the incident icon to show its detail information;
5. You can adjust playback speed by clicking on the “-”, “1x”, and “+” button; you can also jump to specific time by dragging the time slider;
6. The clock shows the animation time. During the animation, each frame is a 15-minute integrated traffic snapshot;
7. Legend shows the speed color table. You can hover mouse over the segment to show its speed and volume information;
8. You can move the clock, legend, and panels to better organize the layout;
9. You can toggle full screen by clicking “Toggle Full Screen” button;
10. You can zoom back to default center area by clicking “Zoom Back” button.