Ramp – Ramp Meter
NDOT and FAST implement and operate ramp meters at major interchange on-ramps. Most of them are operating at traffic responsive mode from 6:00 to 9:00 AM and 1:30 to 6:00 PM. Ramp volume data are collected by video/loop detection around the stop bar.
The Ramp Meter Page allows user to view ramp meter basic information, such as the number of lanes and locations; and will help operation and design with the following:
· Identify and evaluate the ramp meter operation strategy, such as operation time, release rate and flushing;
· Identify when the ramp meter is operating beyond its capacity and when flushes happen;
· Adjust arterial signal timing to avoid over-spill;
· Provide data for simulation and modeling input and validation, and for ramp meter design.
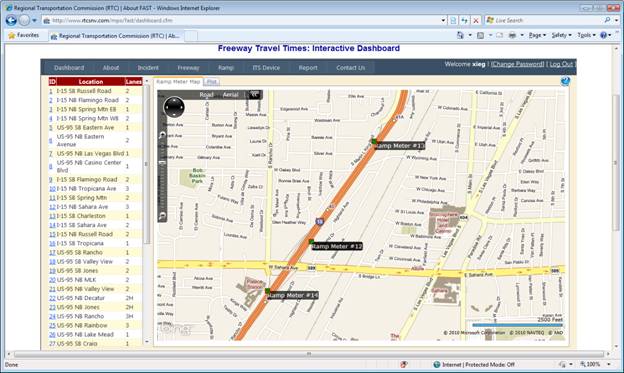
Ramp Meter List and Map
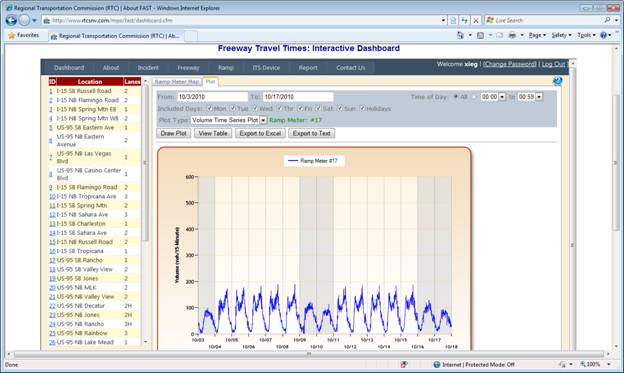
Ramp Meter Volume Time Series Plot
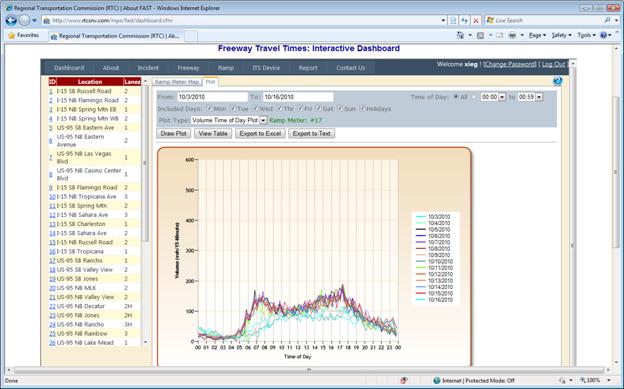
Ramp Meter Volume Time of Day Plot
How to use:
1. Select a ramp meter from the list on the left pane or from the interactive map on the right pane. The ramp meter list shows the ramp meter ID, location, and how many lanes. If the ramp meter has HOV lane, the “Lanes” will be followed by “H”. Click on the ramp meter ID in the list, the map will pan and zoom to its location; You may also select a ramp meter by clicking on its icon on the map;
2. Ramp Meter Volume Plot: You may view the ramp meter plot on the “Plot” tab.
3. Select the date range, time of day, day of week from the top panel;
4. Select a plot type. If the ramp meter has video detection, volumes by video detection is available in the plot type list; if the video detection volume interval is setup as 5 minute, “5-minute, video” option is available;
5. Click “Draw Plot” to show the volume plot; Click “View Table” to show the corresponding data; Click “Export to Excel” or “Export to Text” to download the data in Excel or Text format.
Note:
· Video detection volume data are collected periodically from the cabinet in the field, so the data are not real time and may be updated 1 or 2 months ago;
· Some ramp meter volume data seem abnormal low from mid August. FAST is investigating this issue.
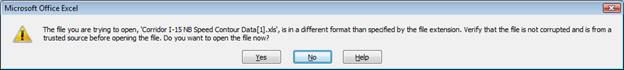
· When open the exported Excel file, Excel 2007 will prompt a warning message as shown in the figure below. You may ignore this message and click “Yes” to open this file.
How to read the plot:
1. Check whether the ramp meter is operating beyond its capacity: For 1-lane ramp meter, the 15-minute capacity is about 225, and 375 for 2-lane or 3-lane ramp meters. If the volume is above the capacity, flush could possibly happen;
2. See flushes from 5-minute video detection plot. The 5-minute video detection plot can clearly show the flushes happen. For example, Tropicana to I-15 Northbound ramp meter has 3 lanes, and the 5-minute capacity is about 125. Flush might happen when the volume is above 125 on the plot. After a flush, the volume drops to almost capacity; when the queue accumulates to the advance queue detection for a while, another flush will happen. You may see the zigzags on the plot below;
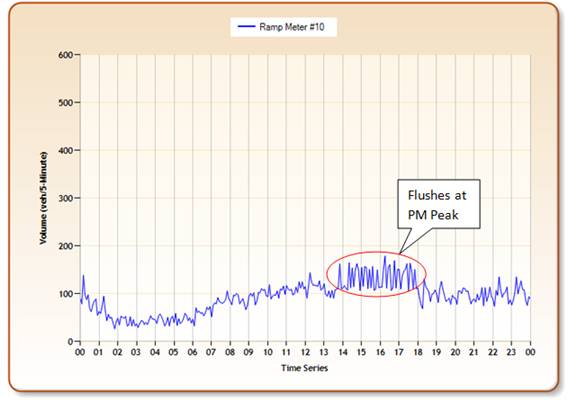
Flushes Demo from Plot (Tropicana to I-15 NB Ramp Meter)
3. The “Time of Day Plot” overlays each day’s plot, so you may easily see the ramp meter volume trend and identify the anomalies. Hover the mouse on the color volume lines will show its date;
4. The “AQD Plot” shows the number of Advance Queue Detection being activated during a 15-minute period. It helps to determine whether the ramp meter storage length is enough; whether the ramp meter release rate is reasonable; and whether adjusting the adjacent arterial signal timing is needed to avoid over-spill.