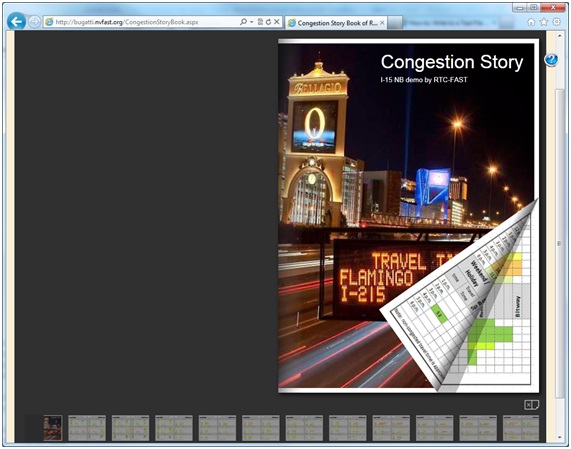
Freeway – Congestion Storybook
Congestion storybook is used to depict the congestion conditions of each corridor / sub-corridor. The storybook applies interactive style which allows the users to turn page or select page. Congestion storybook provides user a quick overview of the current and historical freeway performances. By comparing each month’s congestion page, the impact of construction activities, ramp meter strategy changes, striping modifications, and freeway capacity increase (HOV lanes open) can be easily observed by users and decision makers.
How to use:
1. Turn to Next Page: Click and hold on the rolled-up page corner on the bottom-right and move mouse to the left;
2. Turn to Previous Page: Click and hold the left page and move mouse to the right;
3. Select Page: Click
on the ![]() under the book, the page
thumbnail list will show up on the bottom of the web page; Hover the mouse on
the thumbnail page, the page will pop-up; Click will open this page directly on
the book.
under the book, the page
thumbnail list will show up on the bottom of the web page; Hover the mouse on
the thumbnail page, the page will pop-up; Click will open this page directly on
the book.
Note:
· Currently, Congestion Storybook is still a demo version which only shows the congestions of the urban freeway segments from year 2009 to 2011.
How to read the book:
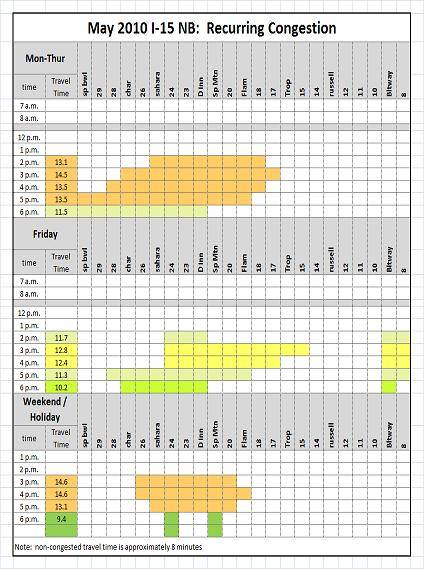
1. Each page is the summary of the typical congestion of the specific month;
2. Monday through Thursday, Friday, and weekend have their own section on each page because Las Vegas Metropolitan Area has different traffic characteristics on these days;
3. Congestion severity is depicted by the colors (green means lighter congestion while red means heavier); Congestion extension is shown by the colorized columns (each column represents a freeway segment and duration), the longer the colorized rows, the wider the congestions; Congestion Duration is listed by the rows (each row describes each hour), the more colorized rows, the longer congestion experienced; Typical Travel Times of each hour is shown on the left accordingly;
4. On this I-15 Northbound congestion demo page, the direction of travel is from the right to left, from Beltway Interchange (I -15 / US-95) to the Spaghetti Bowl Interchange (I -15 / US-95);
5. The express lane project construction in July and August 2009, adding the 3rd lane of Tropicana ramp meter, partially opening HOV lane to Flamingo, and fully opening HOV lanes can be easily observed from each page by users, professionals, and decision makers.
Note:
· The congestions shown in this demo are recurring congestion without crash impact.