ITS Device – Sensor
NDOT and FAST implement radar or loop detectors about 1/3 mile along the urban freeway in Las Vegas Metropolitan Area. Detection data include traffic speed, volumes, occupancy, and classified volumes by vehicle lengths, which are the major data sources to provide travel times to public and to monitor and evaluate the freeway performance. On this Sensor Page, the detectors are organized by freeways and listed by sequence on the left pane; the right pane has an interactive map allows users to locate and view detectors.
The Sensor Page will help users, professionals and decision makers with the followings:
· Various plots exhibit the specific freeway segment traffic characteristics from different perspectives;
· Lane-by-lane plots help monitor the HOV and Express lanes usage and evaluate their performance;
· Classified vehicle counts provide data for the truck route and truck lane study;
· Provide data for simulation, modeling and planning input and validation, and for work zone traffic control;
· Identify malfunctioning detectors, controllers and communications.
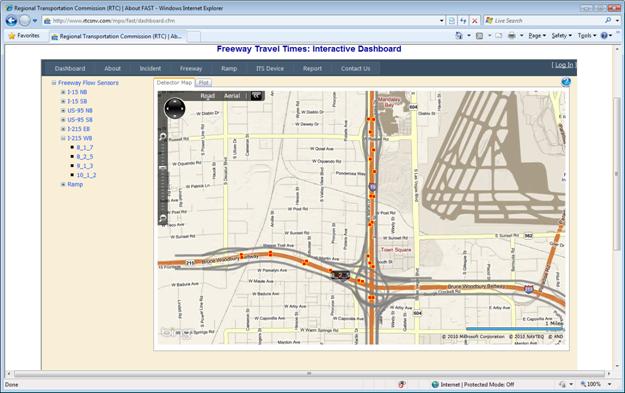
Detector List and Map
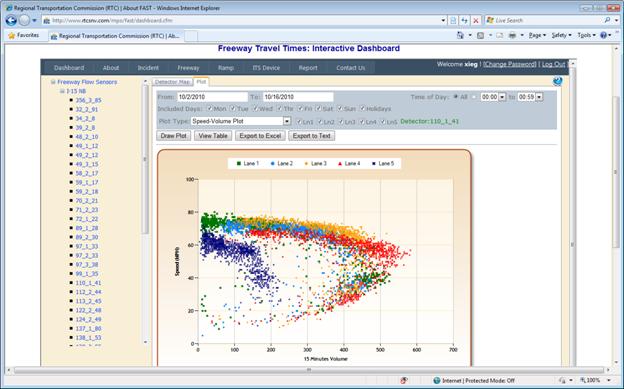
Detector Speed - Volume Plot
How to use:
1. Select Detector: You can click on a detector node from the tree list on the left pane or from the interactive map on the right pane. The detectors are organized by freeways and listed by sequence. Hover the mouse on the detector ID will show the detector location description to better find the specific detector. After clicking on the detector node in the tree list, the map will pan and zoom to its location; you may also select a detector by directly clicking on its icon on the map. When a detector is selected, a detector ID label will appear next to it;
2. Plot: You may select the various plots on the “Plot” tab;
3. Select the date range, time of day, day of week from the top panel;
4. Select a plot type and lanes. Please note that some plots allow multiple lane selection; while some plots can only select one lane to plot at a time;
5. Click “Draw Plot” to show the plot; Click “View Table” to show the corresponding data; Click “Export to Excel” or “Export to Text” to download the data in Excel or Text format.
Note:
· Lanes are numbered sequentially starting from 1 on the left (median) to the right (shoulder);
· If the detector is also detecting the express lane, the lane number will be followed by “E”, like “Ln1E”;
· HOV lane on US-95 is from Valley View to Lake Mead Blvd on Lane 1. The look-up table is shown below:
HOV Lane Look-up Table
|
Route |
Detector ID |
Location |
HOV Lane |
|
US-95 NB |
326_1_72 |
between I-15 NB On and Rancho On |
1 |
|
326_2_195 |
between Rancho On and Valley View Off |
1 |
|
|
328_1_195 |
between Valley View Off and Valley View |
1 |
|
|
328_2_202 |
west of Valley View |
1 |
|
|
335_2_207 |
between Decatur Off and Valley View On |
1 |
|
|
339_2_203 |
between Valley View On and w/o Decatur |
1 |
|
|
344_1_203 |
between west of Decatur and Decatur On |
1 |
|
|
413_1_208 |
between Decatur On and Jones Off |
1 |
|
|
413_2_208 |
between Jones Off and Jones |
1 |
|
|
413_3_204 |
between Jones and Jones On |
1 |
|
|
414_1_209 |
between Jones On and Torrey Pines |
1 |
|
|
414_2_209 |
between Torrey Pines and Rainbow Off |
1 |
|
|
414_3_223 |
between Rainbow Off and Rainbow |
1 |
|
|
415_1_223 |
between Rainbow and Washington |
1 |
|
|
415_2_214 |
between Washington and Rainbow On |
1 |
|
|
415_3_215 |
between Rainbow On and Vegas |
1 |
|
|
US-95 SB |
406_1_219 |
between LMB West On and LMB East On |
1 |
|
406_2_232 |
Vegas |
1 |
|
|
406_3_232 |
between Vegas and Rainbow |
1 |
|
|
406_4_218 |
between Washington and Rainbow |
1 |
|
|
405_1_213 |
between Rainbow and Summerlin On |
1 |
|
|
405_2_206 |
between Summerlin On and Rainbow On |
1 |
|
|
405_3_206 |
between Rainbow On and Jones Off |
1 |
|
|
404_1_200 |
between Jones Off and Jones |
1 |
|
|
404_2_212 |
between Jones and Jones On |
1 |
|
|
404_3_212 |
between Jones and Decatur Off |
1 |
|
|
343_1_199 |
between Decatur Off and Decatur |
1 |
|
|
337_2_211 |
between Decatur and east of Decatur |
1 |
|
|
334_2_211 |
between east of Decatur and w/o Valley View |
1 |
|
|
329_2_198 |
between west of Valley View and Decatur On |
1 |
|
|
327_1_205 |
between Decatur On and HOV ends |
1 |
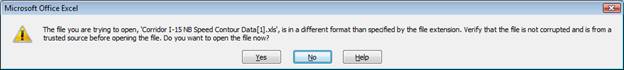
· When open the exported Excel file, Excel 2007 will prompt a warning message as shown in the figure below. You may ignore this message and click “Yes” to open this file.
How to read and explain the plot:
1. “Speed-Volume” Plot shows the classical speed-volume curve which you can find in Traffic Engineering Text Book. Please note the volume is of 15-minute interval. If you need hourly volume, please estimate from this plot or calculated from the data in the table;
2. “Time Series Plot”: For time series type plot, you may have the options of plotting the speed, volume, stacked volumes, occupancy, all-in-one, and poll count. This type of plot will show the measure changes along the date and time. The X-axis label will change according to the date range you selected. It will show hours label if the date range is less than 3 days. The weekend days are shaded with gray color;
3. “Stacked Volume Time Series Plot” shows the total volume of all the lanes and individual volume of each lane by different colors, as shown in the figure below;
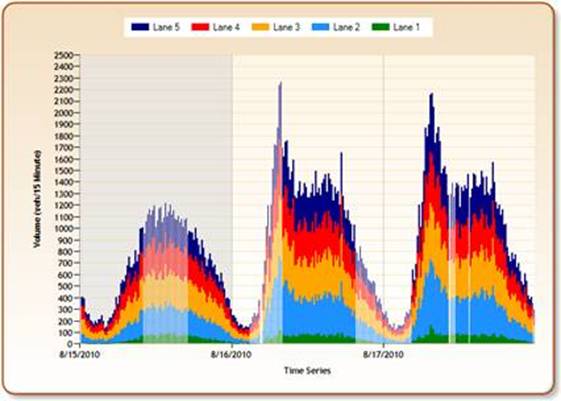
Stacked Volume Time Series Plot
4. “All-in-One Time Series Plot” shows the speed, volume and occupancy on one plot, which helps to investigate the relationship between these three measures. It can also help to identify the congestion whether is caused by crash or by travel demand beyond capacity;
5. “Time of Day Plot”: Time of Day Plot overlays each day’s plot, so you may easily see the trend and identify the anomalies of the selected measures. You may also see the difference between weekdays and weekend. Hover the mouse on the color lines will show its date to identify it belongs to which date, as shown in the figure below;
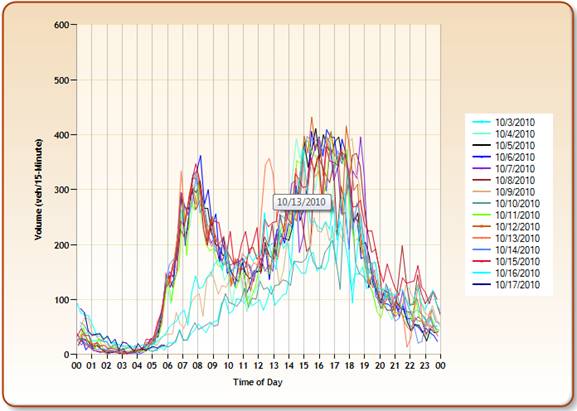
Volume Time of Day Plot
6. “Poll Count Time Series Plot” will help FAST technicians to monitor detector health, identify malfunctioning detectors, controllers or communications. FAST Freeway Management System polls detectors every minute, so normally there should be 15 polls during a 15-minute interval. Good or bad devices can be easily identified from the poll count plots, as shown in the two figures below.
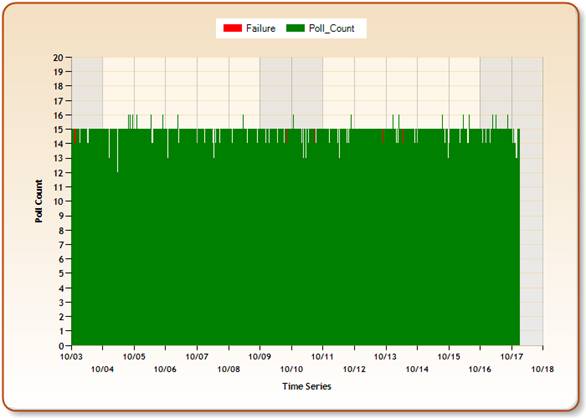
Poll Count Time Series Plot of Good Detector
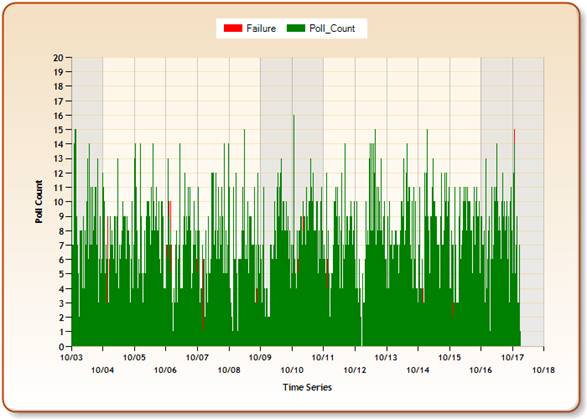
Poll Count Time Series Plot of Bad Detector