Interactive
Dashboard - Performance Monitoring and Measurement System (PMMS)
Homepage Dashboard
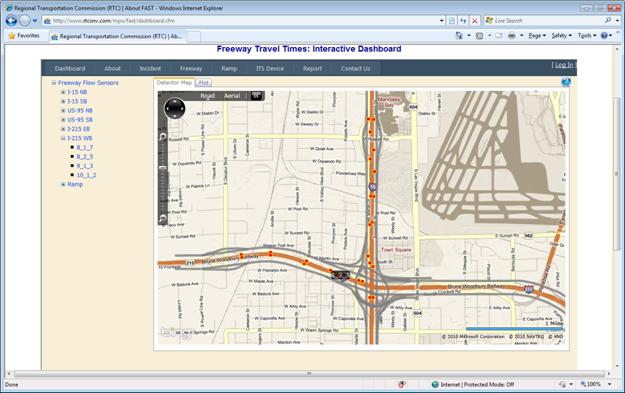
Freeway Travel Times: Interactive Dashboard home page dashboard monitors and presents Las Vegas
Metropolitan Freeway real time and historical traffic condition through Maps,
Daily Peak Speeds, Time of Day Speeds, Average Speed and Congestion Plots from
different perspective, as shown in the screenshot below.

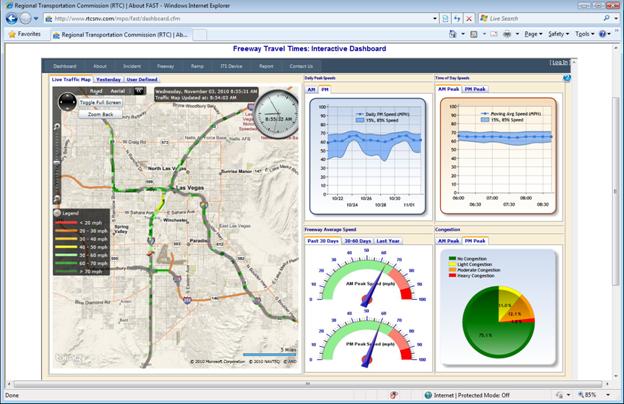
Traffic Map
·
Live
Traffic Map refreshes itself every minute by the detection data polled from the
sensors implemented about 1/3 mile spacing along the freeways;
·
Crash
/ Construction / Incident information is updated real time by FAST TMC
operators;
·
Full
screen mode is better used for TMC monitoring or fleet dispatchers;
·
Yesterday
or historical traffic can be reviewed by user-defined animation playback;
·
Segment
and crash is clickable to show detail information.
Daily Peak Speeds
·
Average,
15th and 85th percentile AM/PM peak speeds are plotted to show the monitored
freeway traffic trend of the past two weeks;
·
Freeway
performance reliability can easily be observed by the 15th and 85th percentile
speed range.
Time of Day Speeds
·
Average,
15th and 85th percentile speeds of each 15-minute slice during the AM/PM peak
are plotted to show the variances within peak hours;
·
Travelers
can choose the best time to avoid the highest peak hour.
Average Speed
·
Overall
freeway performance of the past 30 days, 30 to 60 days peak hours can be easily
read from the speedometers;
·
Freeway
performance improvement can be observed by comparing the speedometers of
different time periods.
Congestion
·
Yesterday
AM/PM peak congestion level can be perceived from the pie charts.
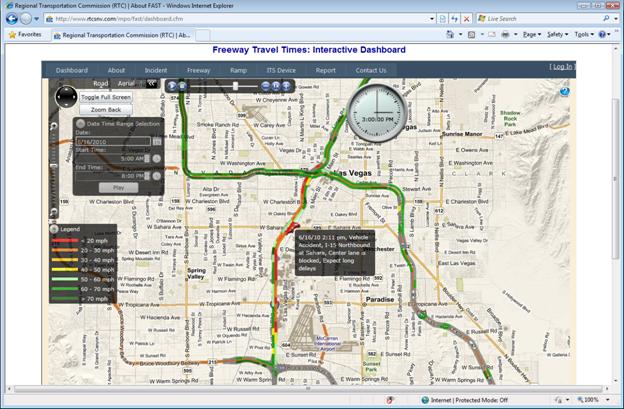
Historical Traffic Animation
Historical traffic can be animated to review and evaluate
the past performance. Every frame is a 15-minute integrated traffic snapshot.
·
User
customizable date and time range;
·
Adjustable
playback speed and time;
·
Movable
clock, legend, and panels to better organize the layout;
·
Traffic
incident will fly-into its location one hour before its occurrence; Flash
during its happening; Fade-out after its clearance to show its residual impact.
PMMS set up a series of nodes and divide Las Vegas
Metropolitan freeways to corridors/sub-corridors, which helps traveler and professionals
to follow specific freeway segments.
Corridor Dashboard
·
Similar
dashboard shows the traffic condition of the specific corridor.
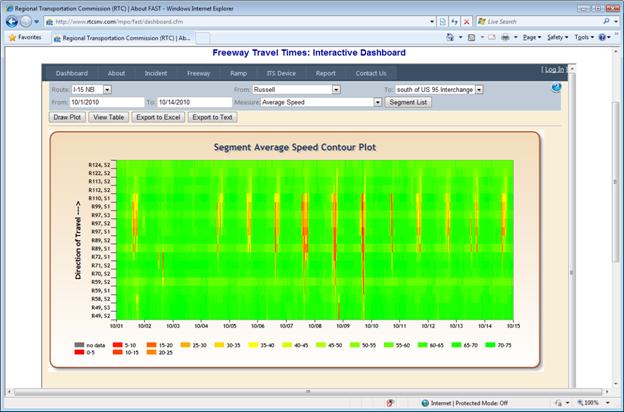
Corridor Traffic Plotting
·
Corridor
traffic contour plotting can present traffic conditions of long stretch of freeway over a
certain time period on one graph;
·
Large
amount of spatial and temporal traffic information can be observed at the same
time;
·
Traffic
pattern, trend, bottleneck, congestion level, impact of crashes can be easily
observed;
·
Corridor
origination and destination, date range, and measures are user customizable;
·
Measures
include average speed, average lane volume, HOV or express lane speed and
volume, general purpose lane speed and volume.
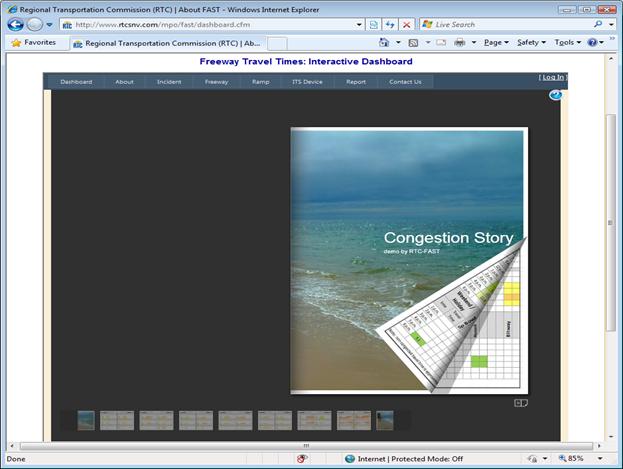
Congestion Storybook
·
User-friendly
Interactive story book style;
·
Each
page presents monthly typical congestion severity, extension and duration, and
travel times on Monday through Thursday, Friday, and weekend;
·
User
can compare different months by selecting corresponding pages on the bottom.
Heavy Congestion (Bottleneck) Dashboard
·
Bottlenecks
are predefined according to performance evaluation and field observation;
·
Dashboard
shows more unreliable and lower speeds of bottlenecks.
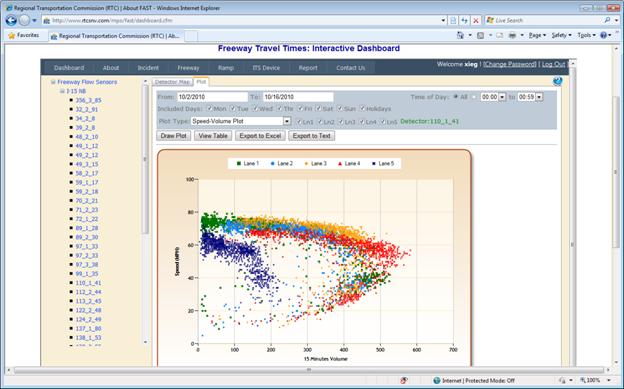
NDOT and FAST implement radar or loop detectors about 1/3
mile along the urban freeway in Las Vegas Metropolitan Area. Detection data
include traffic speed, volume, occupancy, and classified volumes by vehicle
lengths, which are the major sources to monitor and evaluate the freeway
performance.
·
Detectors
are organized by freeways and listed by sequence;
·
Interactive
map allows users to find and locate detectors;
·
User
customizable interface allows users to select date range, time of day, day of
week, and specific lanes;
·
Lane-by-lane
plots help monitor the HOV and Express lanes usage and evaluate their
performance;
·
Provide
speed, volume and occupancy threshold parameters for TMC congestion management;
·
Classified
vehicle counts provide data for the truck route and truck lane study;
·
Various
plots exhibit the specific freeway segment characteristics from different
perspectives;
·
Provide
data for simulation, modeling and planning input and validation, and for work
zone traffic control;
·
Monitor
detector health and Identify malfunctioning detectors, controllers and
communications.
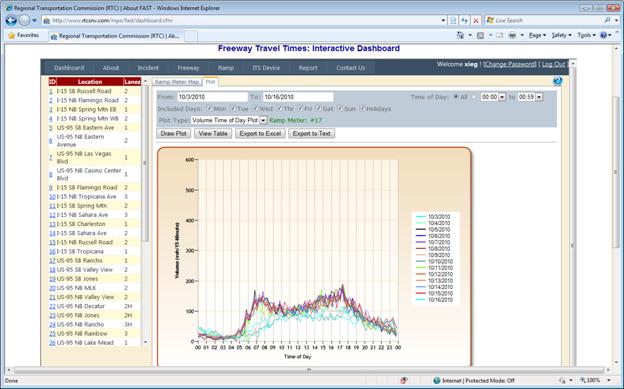
NDOT and FAST implement and operate ramp meters at major
interchange on-ramps. Most of them are operating at traffic responsive mode
from 6:00 to 9:00 AM and 1:30 to 6:00 PM. Ramp volumes are collected by
video/loop detection around the stop bar.
·
Interactive
map allows users to find and locate ramp meters;
·
User
customizable interface allows users to select date range, time of day, and day
of week to draw plots or download data;
·
Help
to identify and evaluate the ramp meter operation strategy, such as operation
time, release rate and flushing;
·
Identify
when the ramp meter is operating beyond its capacity and when flushes happen;
·
Help
to adjust arterial signal timing to avoid over-spill;
·
Provide
data for simulation and modeling input and validation, and for ramp meter
design.
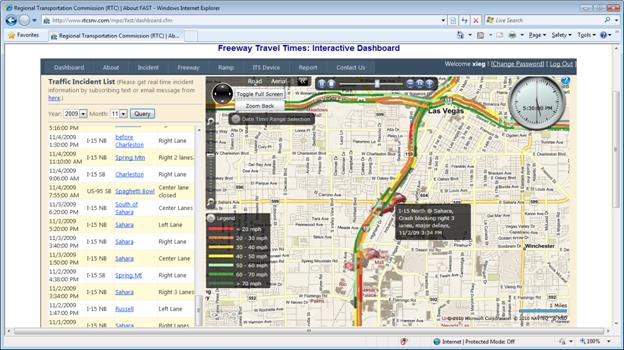
Incident – Historical Incidents
FAST TMC operators monitor and report incidents to the
public. TMC operators record which lanes are blocked, tow truck arrival time
and lane clearance time. This information is very critical for traffic impact
study and incident clearance evaluation.
Operators report incident to the
public through several ways:
1. Add new incident by
several simple clicks on the map, and then the incident is updated on the live
traffic map which is available to public;
2. Send out text and
email message which is generated by PMMS;
3. Terminate the
incident when lanes are cleared. Then the incident will fade out on the live
traffic map.
·
Query
incidents by month and corridor;
·
Incident
animation plays from one hour before the incident to one hour after its
clearance to demonstrate the traffic condition and the impact before, during
and after the incident;
·
Incident
will fly-into its location one hour before its occurrence; Flash during its
happening; Fade-out after its clearance to show its residual impact.
·
Help
to identify the secondary crash;
·
Help
to evaluate the incident clearance to improve future traffic incident
management.