FAST Dashboard
- Performance Monitoring and Measurement System
http://bugatti.nvfast.org
Dashboard Homepage
FAST dashboard home page monitors and presents Las Vegas
Metropolitan Freeway real time and historical traffic condition through Maps,
Daily Peak Speeds, Time of Day Speeds, Average Speed and Congestion Plots from
different perspective, as shown in the screenshot below.
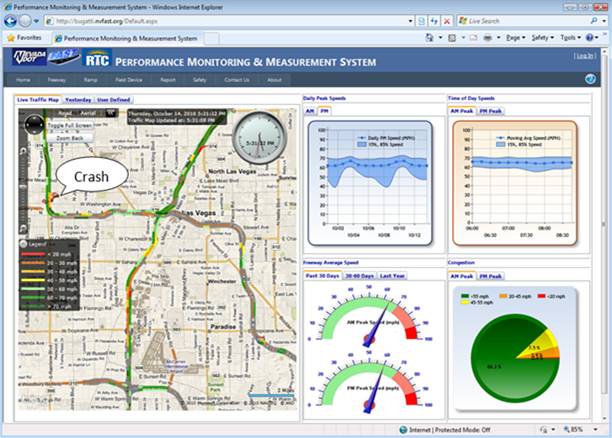
Live Traffic Map
·
Live
Traffic Map refreshes itself every minute by the detection data polled from the
sensors implemented about 1/3 mile spacing along the freeways;
·
Crash
/ Construction / Incident information is updated real time by FAST TMC
operators;
·
Full
screen mode is better used for TMC monitoring or fleet dispatchers;
·
Yesterday
or historical traffic can be reviewed by user-defined animation playback;
·
Segment
and crash is clickable to show detail information.
Daily Peak Speeds
·
Average,
15th and 85th percentile AM/PM peak speeds are plotted to show the monitored
freeway traffic trend of the past two weeks;
·
Freeway
performance reliability can easily be observed by the 15th and 85th percentile
speed range.
Time of Day Speeds
·
Average,
15th and 85th percentile speeds of each 15-minute slice during the AM/PM peak
are plotted to show the variances within peak hours;
·
Travelers
can choose the best time to avoid the highest peak hour.
Average Speed
·
Overall
freeway performance of the past 30 days, 30 to 60 days peak hours can be easily
read from the speedometers;
·
Freeway
performance improvement can be observed by comparing the speedometers of
different time periods.
Congestion
·
Yesterday
AM/PM peak congestion level can be perceived from the pie charts.
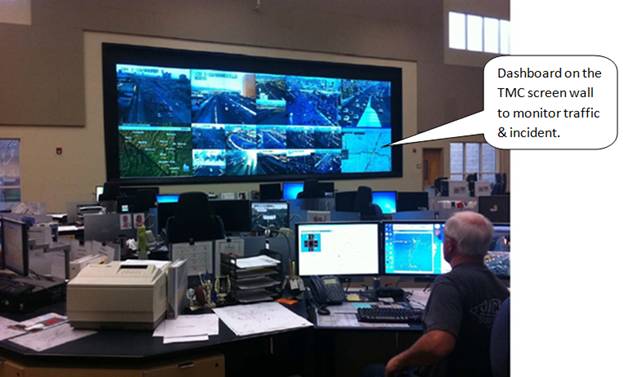
Live traffic map is also displayed on the FAST TMC Screen
Wall to monitor and share the traffic & incident information.
Historical Traffic Animation
Historical traffic can be animated to review and evaluate
the past performance. Every frame is a 15-minute integrated traffic snapshot.
·
User
customizable date and time range;
·
Adjustable
playback speed and time;
·
Movable
clock, legend, and panels to better organize the layout;
·
Traffic
incident will fly-into its location one hour before its occurrence; Flash
during its happening; Fade-out after its clearance to show its residual impact.
Safety – Incident Management, Analysis,
and Playback
FAST TMC operators monitor and report incidents to the
public. Using the Dashboard’s "New Incident" page, TMC operators only need a
few clicks on the map and pop-up window to compose and distribute detailed
messages to the public. Key information of this incident is recorded, such as
lane blockage, tow truck arrival time and lane clearance time, secondary crash
or not, and severity. This information is very critical for traffic impact
studies, TIM Coalition efforts, and quick-clearance benefit evaluation. The
screenshot below shows the interface to add the incident. In just a few
seconds, the incident can be added and with lots of key information being
logged, and it will immediately show up on the live traffic map available to
public. It greatly enhances FAST TMC operators’ quick response to the
incidents.
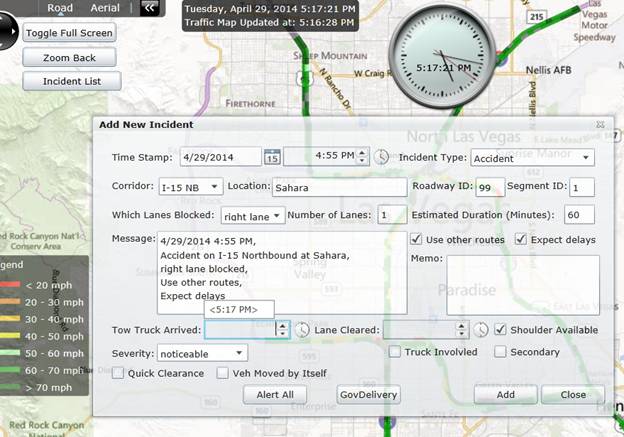
Add Incident Interface
Incident Analysis
The
incidents are logged in the Dashboard database. When using the "Historical
Crash Analysis", the key crash information is automatically analyzed spatially,
temporally, by severity, and by clearance time. And the results are displayed
by various charts, plots, graphs, tables and map. For example, under the
spatial tab, the pie charts show the percentages of the crashes by corridor and
by workzone. Also the table shows the top 10 crash locations. Under the
temporal tab, the crashes are analyzed by day type, day of week, time of day,
and peak periods. This page is only accessible to
approved users.
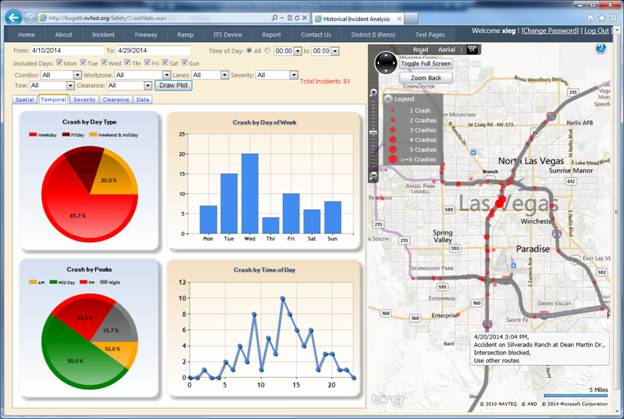
Historical Incident Analysis
Incident Playback/Review
For particular incident, sometimes we need to review
·
How
the incident is cleared;
·
How
the emergency responders work on the scene;
·
What
is the impact to traffic;
·
How
long the queue is and how it dissipates.
When FAST TMC operators add an incident, the Dashboard
triggers the camera snapshots archiving function. The snapshots are archived at
15-second intervals for one camera downstream of the segment and several
upstream cameras depending on the location. Even after the incident is cleared,
the Dashboard continues archiving for a certain period of time depending on the
severity to monitor how the queue dissipates.
This function is extremely useful to evaluate the TIM
Coalition’s Quick Clearance Program benefits. For example, on I-15 NB at Sahara
Ave, a highly volatile freeway segment, we have determined that, due to TIM
strategies, 35 to 45 percent of incidents are cleared from travel lanes in 10
minutes or less. And the snapshot playback tool is used by NHP emergency
responders to review and enhance their work at the scene, for example whether a
lane is blocked unnecessarily. The two snapshots below are the Historical
Traffic Animation and Snapshots Playback page. Traffic incident icons will
fly-into the crash location one hour before its occurrence; flash during
clearance; and fade as traffic queues dissipate. This function is also useful
to identify secondary incidents. The camera snapshots
playback function is only accessible to approved users.
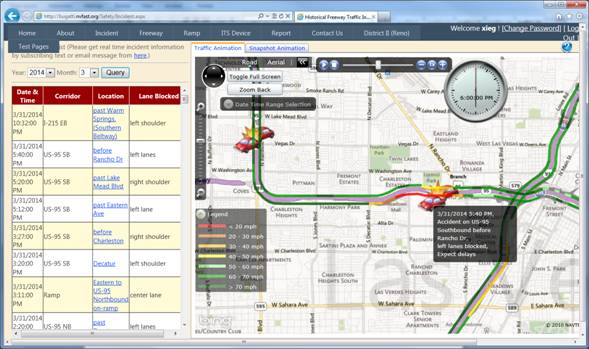
Historical Traffic Animation
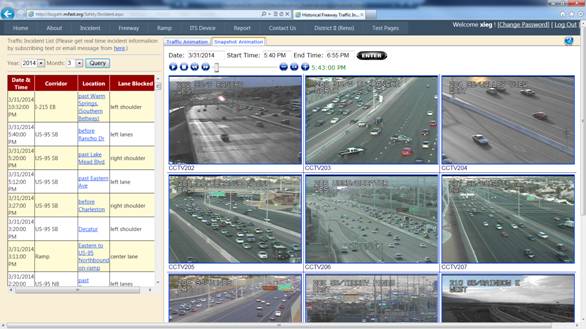
Incident Snapshots Playback
PMMS set up a series of nodes and divide Las Vegas
Metropolitan freeways to corridors/sub-corridors, which helps traveler and professionals
to follow specific freeway segments.
Corridor Dashboard
·
Similar
dashboard shows the traffic condition of the specific corridor.
Corridor Contour
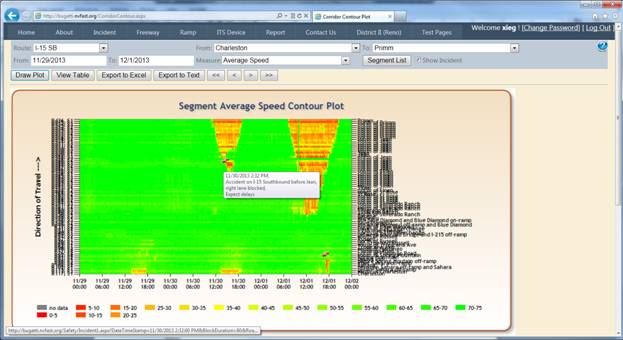
·
Corridor
contour can present traffic conditions of long stretch of freeway over a
certain time period on one graph;
·
Large
amount of spatial and temporal traffic information can be observed at the same
time;
·
Traffic
impact of incident/special event can be identified. Icon is clickable to show
historical playback popup window;
·
Traffic
pattern, trend, bottleneck, congestion level, impact of crashes can be easily
observed;
·
Corridor
origination and destination, date range, and measures are user customizable;
·
Measures
include average speed, average lane volume, HOV or express lane speed and
volume, general purpose lane speed and volume.
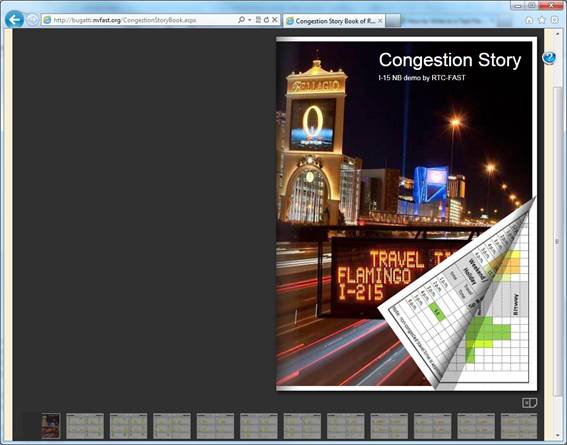
Congestion Story Book
·
User-friendly
Interactive story book style;
·
Each
page presents monthly typical congestion severity, extension and duration, and
travel times on Monday through Thursday, Friday, and weekend;
·
User
can compare different months by selecting corresponding pages on the bottom.
Bottleneck Dashboard
·
Bottlenecks
are predefined according to performance evaluation and field observation;
·
Dashboard
shows more unreliable and lower speeds of bottlenecks.
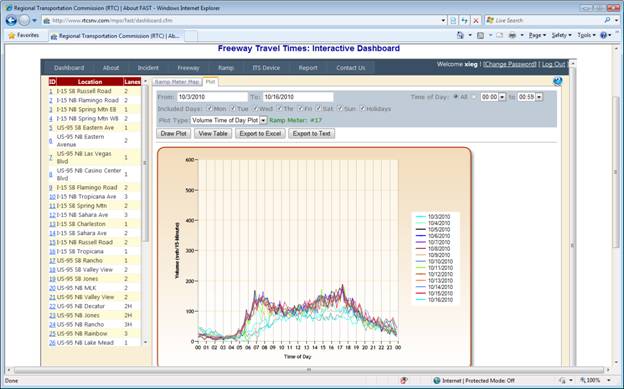
NDOT and FAST implement radar or loop detectors about 1/3
mile along the urban freeway in Las Vegas Metropolitan Area. Detection data
include traffic speed, volume, occupancy, and classified volumes by vehicle
lengths, which are the major sources to monitor and evaluate the freeway
performance.
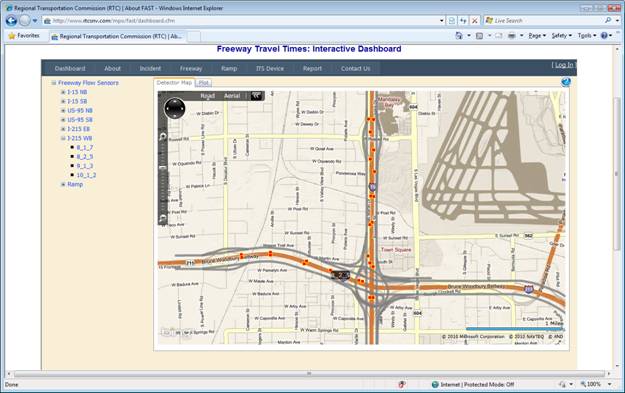
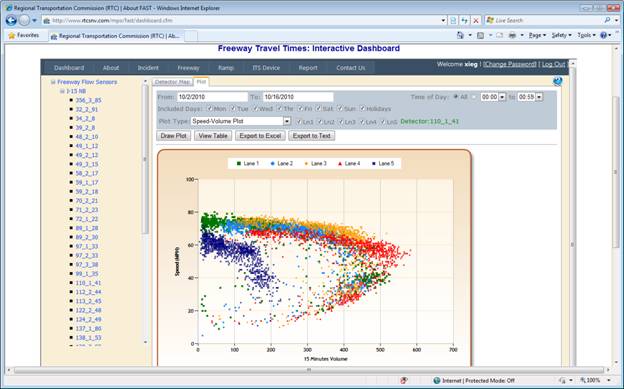
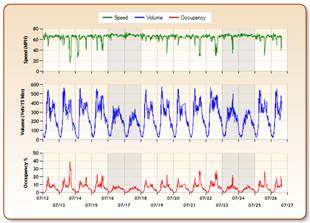
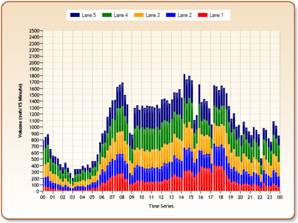
All-in-One Time Series Plot Stacked Volume Time
Series Plot
·
Detectors
are organized by freeways and listed by sequence;
·
Interactive
map allows users to find and locate detectors;
·
User
customizable interface allows users to select date range, time of day, day of
week, and specific lanes;
·
Lane-by-lane
plots help monitor the HOV and Express lanes usage and evaluate their
performance;
·
Provide
speed, volume and occupancy threshold parameters for TMC congestion management;
·
Classified
vehicle counts provide data for the truck route and truck lane study;
·
Various
plots exhibit the specific freeway segment characteristics from different
perspectives;
·
Provide
data for simulation, modeling and planning input and validation, and for work
zone traffic control;
·
Monitor
detector health and Identify malfunctioning detectors, controllers and
communications.
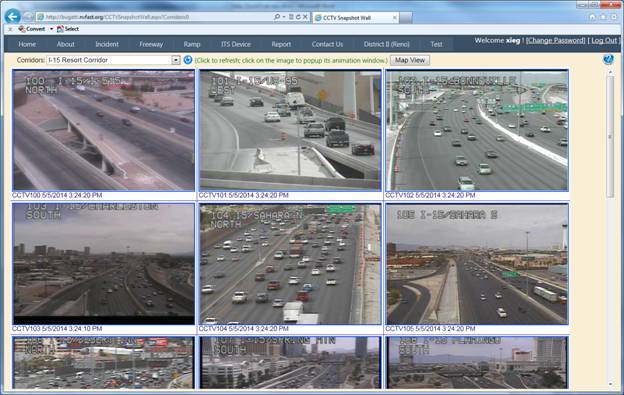
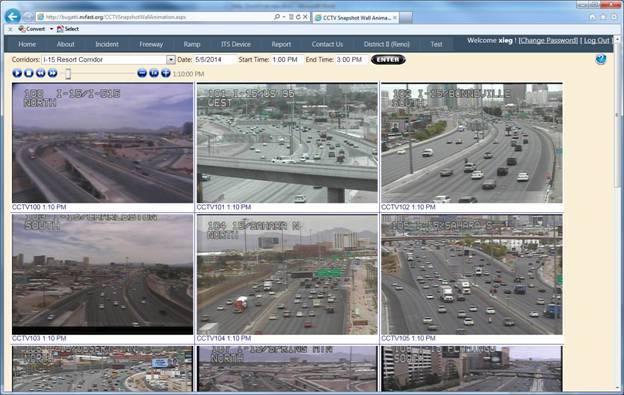
ITS Device – Camera Snapshot Wall
FAST operates over 400 cameras in Southern Nevada. The
Dashboard not only has a camera map, but also this featured Camera Snapshot
Wall page. The cameras are grouped by freeways, corridors and area or by
special events, like NASCAR, CES Show, Electric Daisy Carnival, UNLV Basketball
or Football games. Users don’t need to click on the camera icon to show the
snapshot one by one; the traffic condition along the whole corridor can be
easily viewed at a glance in a few seconds. This feature is innovative and is
not seen on other websites. The camera can be added to any group without adding
extra processing power to the server.
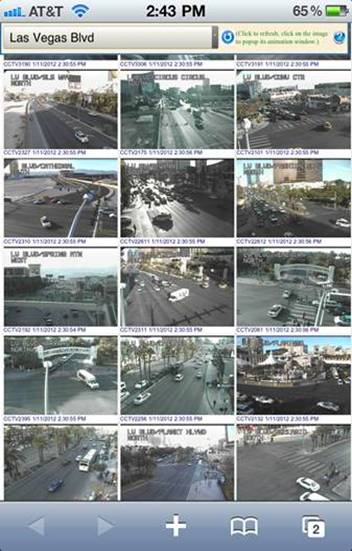
It is extensively used by radio traffic reporter and fleet
dispatchers. It has a desktop viewer version and mobile version. It is like a
mobile TMC screen wall in everybody’s hand. Users don’t need to install any
app; they just need to type in the address http://bugatti.nvfast.org/CCTVSnapshotWall.aspx
in the smart phone or tablet browser. It can be simply added it to the iPhone
home screen and works like an app.
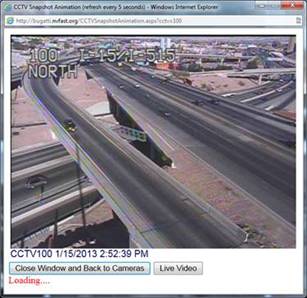
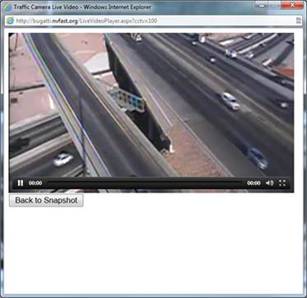
ITS Device – Traffic Camera Live Streaming
Video
When a user is interested in one of the cameras on the
snapshot wall page, he/she can click on the camera and a popup window will
update the snapshot every 5 seconds and provide "Live Video" capability. It
will stream the video to the user’s browser. It works on all browsers and
devices, desktop or mobile, Apple or Android.
The beauty of this feature is that it doesn’t require
extensive computing power to stream all the 400 cameras. It is on-demand
streaming video. When the first user clicks on the "Live Video" button, it
starts the streaming process. Additional use will extend the streaming video
time. In reality, there are not many users streaming at the same time, so the
dashboard only requires one server to handle all the streaming requests. Unlike
traditional public systems that require an array of powerful servers to provide
fewer CCTV images to a limited number of browsers, the FAST Dashboard’s
on-demand method is the most cost-effective way to provide live streaming video
for all cameras.
ITS Device – Camera Snapshot Wall
Animation
Over 400 cameras snapshots are achieved at 5-minute
interval, and can be animated using this Camera Snapshot Wall Animation page.
User can customize the corridor, date and time period and playback speed.
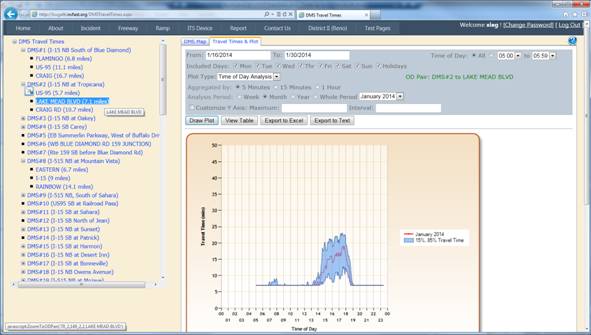
ITS Device – DMS Travel Times and
Anlaysis
The FAST TMC currently displays travel times to 110
destinations on 42 DMSs, and the DMS messages are archived in the database.
This function parses the messages and extracts the destinations and travel
times from the messages, and stores them in the Dashboard database. Public can
use this page to query historical travel times and analyze the 15% and 85%
travel times so that they know their commuting route’s normal travel time and
once-in-a-month longest travel time. This function has also been used by FAST
TMC to verify the DMS travel time accuracy, especially when new DMSs are
installed and start posting travel times.
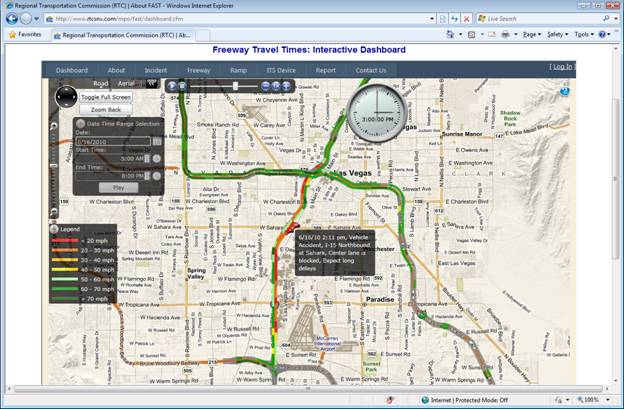
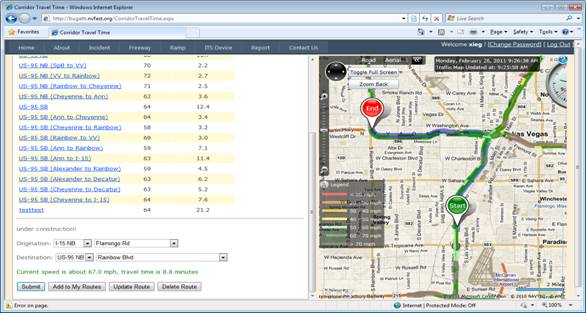
Corridor Travel Time and User Defined
Travel Time
Corridor Travel
Time page presents the speed and travel times of the system’s predefined routes
and user defined routes. The travel times displayed on this page automatically
update every minute. It can also query any OD-pair travel time on the fly. When
a user selects a route, the route is highlighted and the origination and
destination are pinned on the live traffic map, as shown in the screenshot
below. The pins can also be dragged to any location on the segments when users
create their own route. This function is used to verify FAST TMC DMS travel time
postings. RTC transit planners also use this to get travel times when designing
proposed transit route schedules.
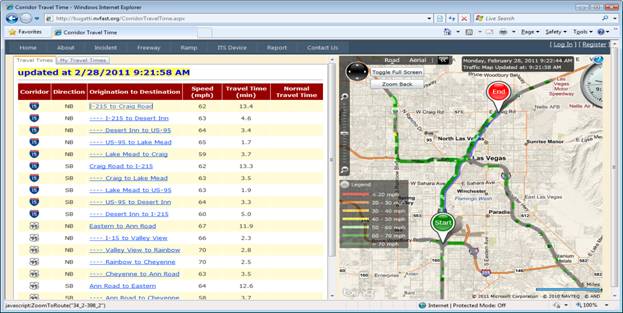
System Defined OD Pairs Travel Times
User Defined Routes Travel Time
NDOT and FAST implement and operate ramp meters at major
interchange on-ramps. Most of them are operating at traffic responsive mode
from 6:00 to 9:00 AM and 1:30 to 6:00 PM. Ramp volumes are collected by
video/loop detection around the stop bar.
·
Interactive
map allows users to find and locate ramp meters;
·
User
customizable interface allows users to select date range, time of day, and day
of week to draw plots or download data;
·
Help
to identify and evaluate the ramp meter operation strategy, such as operation
time, release rate and flushing;
·
Identify
when the ramp meter is operating beyond its capacity and when flushes happen;
·
Help
to adjust arterial signal timing to avoid over-spill;
·
Provide
data for simulation and modeling input and validation, and for ramp meter
design.
FAST Dashboard Adopted and Deployed by
Other Agencies
Migrated and Deployed to NDOT
Reno Area
Since NDOT District II is using the same data format as Las
Vegas area. The FAST Dashboard has been easily migrated and deployed to NDOT
District II. Besides that, a new feature, wind warning map is added to the home
page. When wind speed is higher than a threshold, high profile vehicles are
either advised to detour or drive with caution. This feature is used by Reno
school bus dispatchers, as well as transit dispatcher and NHP state highway
troopers.
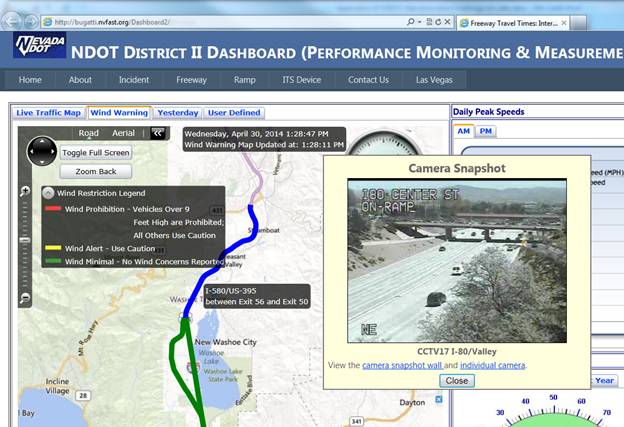
NDOT District II (Reno Area) Dashboard
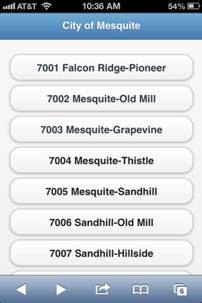
Streaming Video Migrated and
Deployed to City of Mesquite
City of Mesquite is very interested in the streaming video
feature of the FAST Dashboard. This feature has been deployed to City of
Mesquite with minimum effort. The hosting server is a virtual machine that
capable of streaming 12 videos. The streaming video is displayed in browser
which can be viewed by full screen. It is being used at City of Mesquite Police
Department and City Hall without any additional cost. City of Mesquite has no
TMC, with this system it can be used as TMC screen wall anywhere.
Besides the live streaming video wall, these streaming video
can also be viewed on Apple or Android mobile devices. The screenshot below
shows it is being viewed on an iPhone.
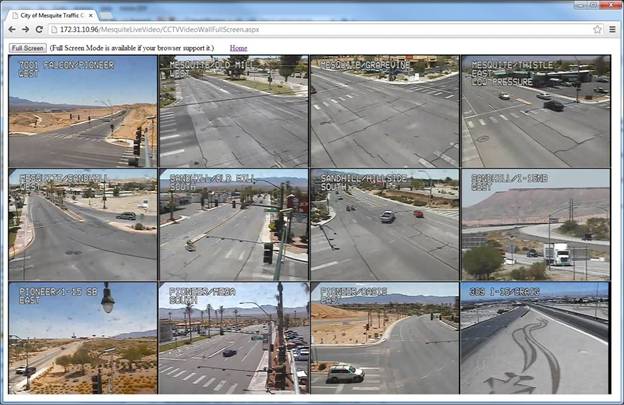
City of Mesquite Live Streaming Video Wall
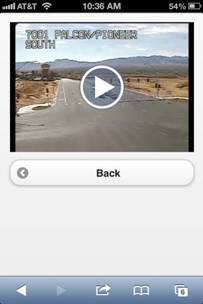
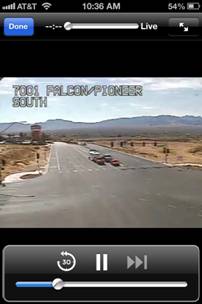
City of Mesquite Live Streaming Video on Smart Phone
Other Features Under Developement
Interactive 3D Plot
This interactive Vehicle Delay Surface 3D Plot is used to
investigate typical vehicle delay on each 1/3 mile segment of a corridor from
hour 0 to 24. By comparing the delay surface of different month, the freeway
performance improvement can be easily observed. For example, I-15 Express Lanes
were opened on 6/25/2010. By comparing the I-15 SB Delay Surface Plots of June
and July, you can observe that delay has been reduced by 50% since the express
lanes opened, and I-15 SB Sahara bottleneck is eliminated.
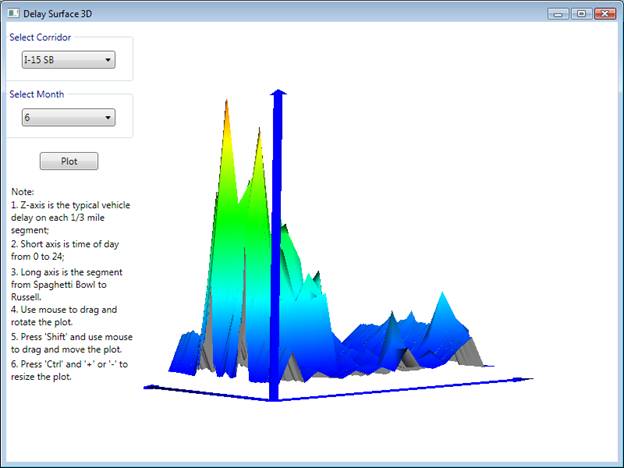
·
3D
Plot is user interactive. Use mouse to drag and rotate the plot; Press "Ctrl"
and "+" or "-" to resize the plot;
·
The
Z-axis is the typical vehicle delay on each 1/3 mile segment;
·
Short
axis is the time of day from 0 to 24;
·
Long
axis is the segment.
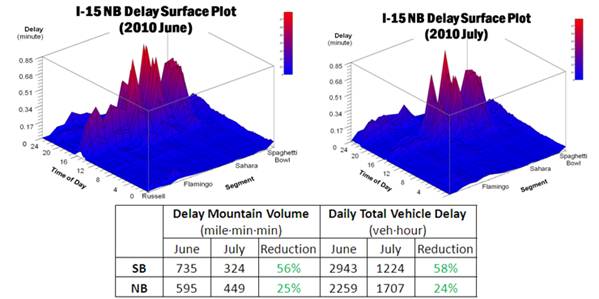
Express Lane Benefit Analysis Using 3D Delay Surface Plot